Data Visualization
Data Visualization
Empowering Your Business with Visual Insights
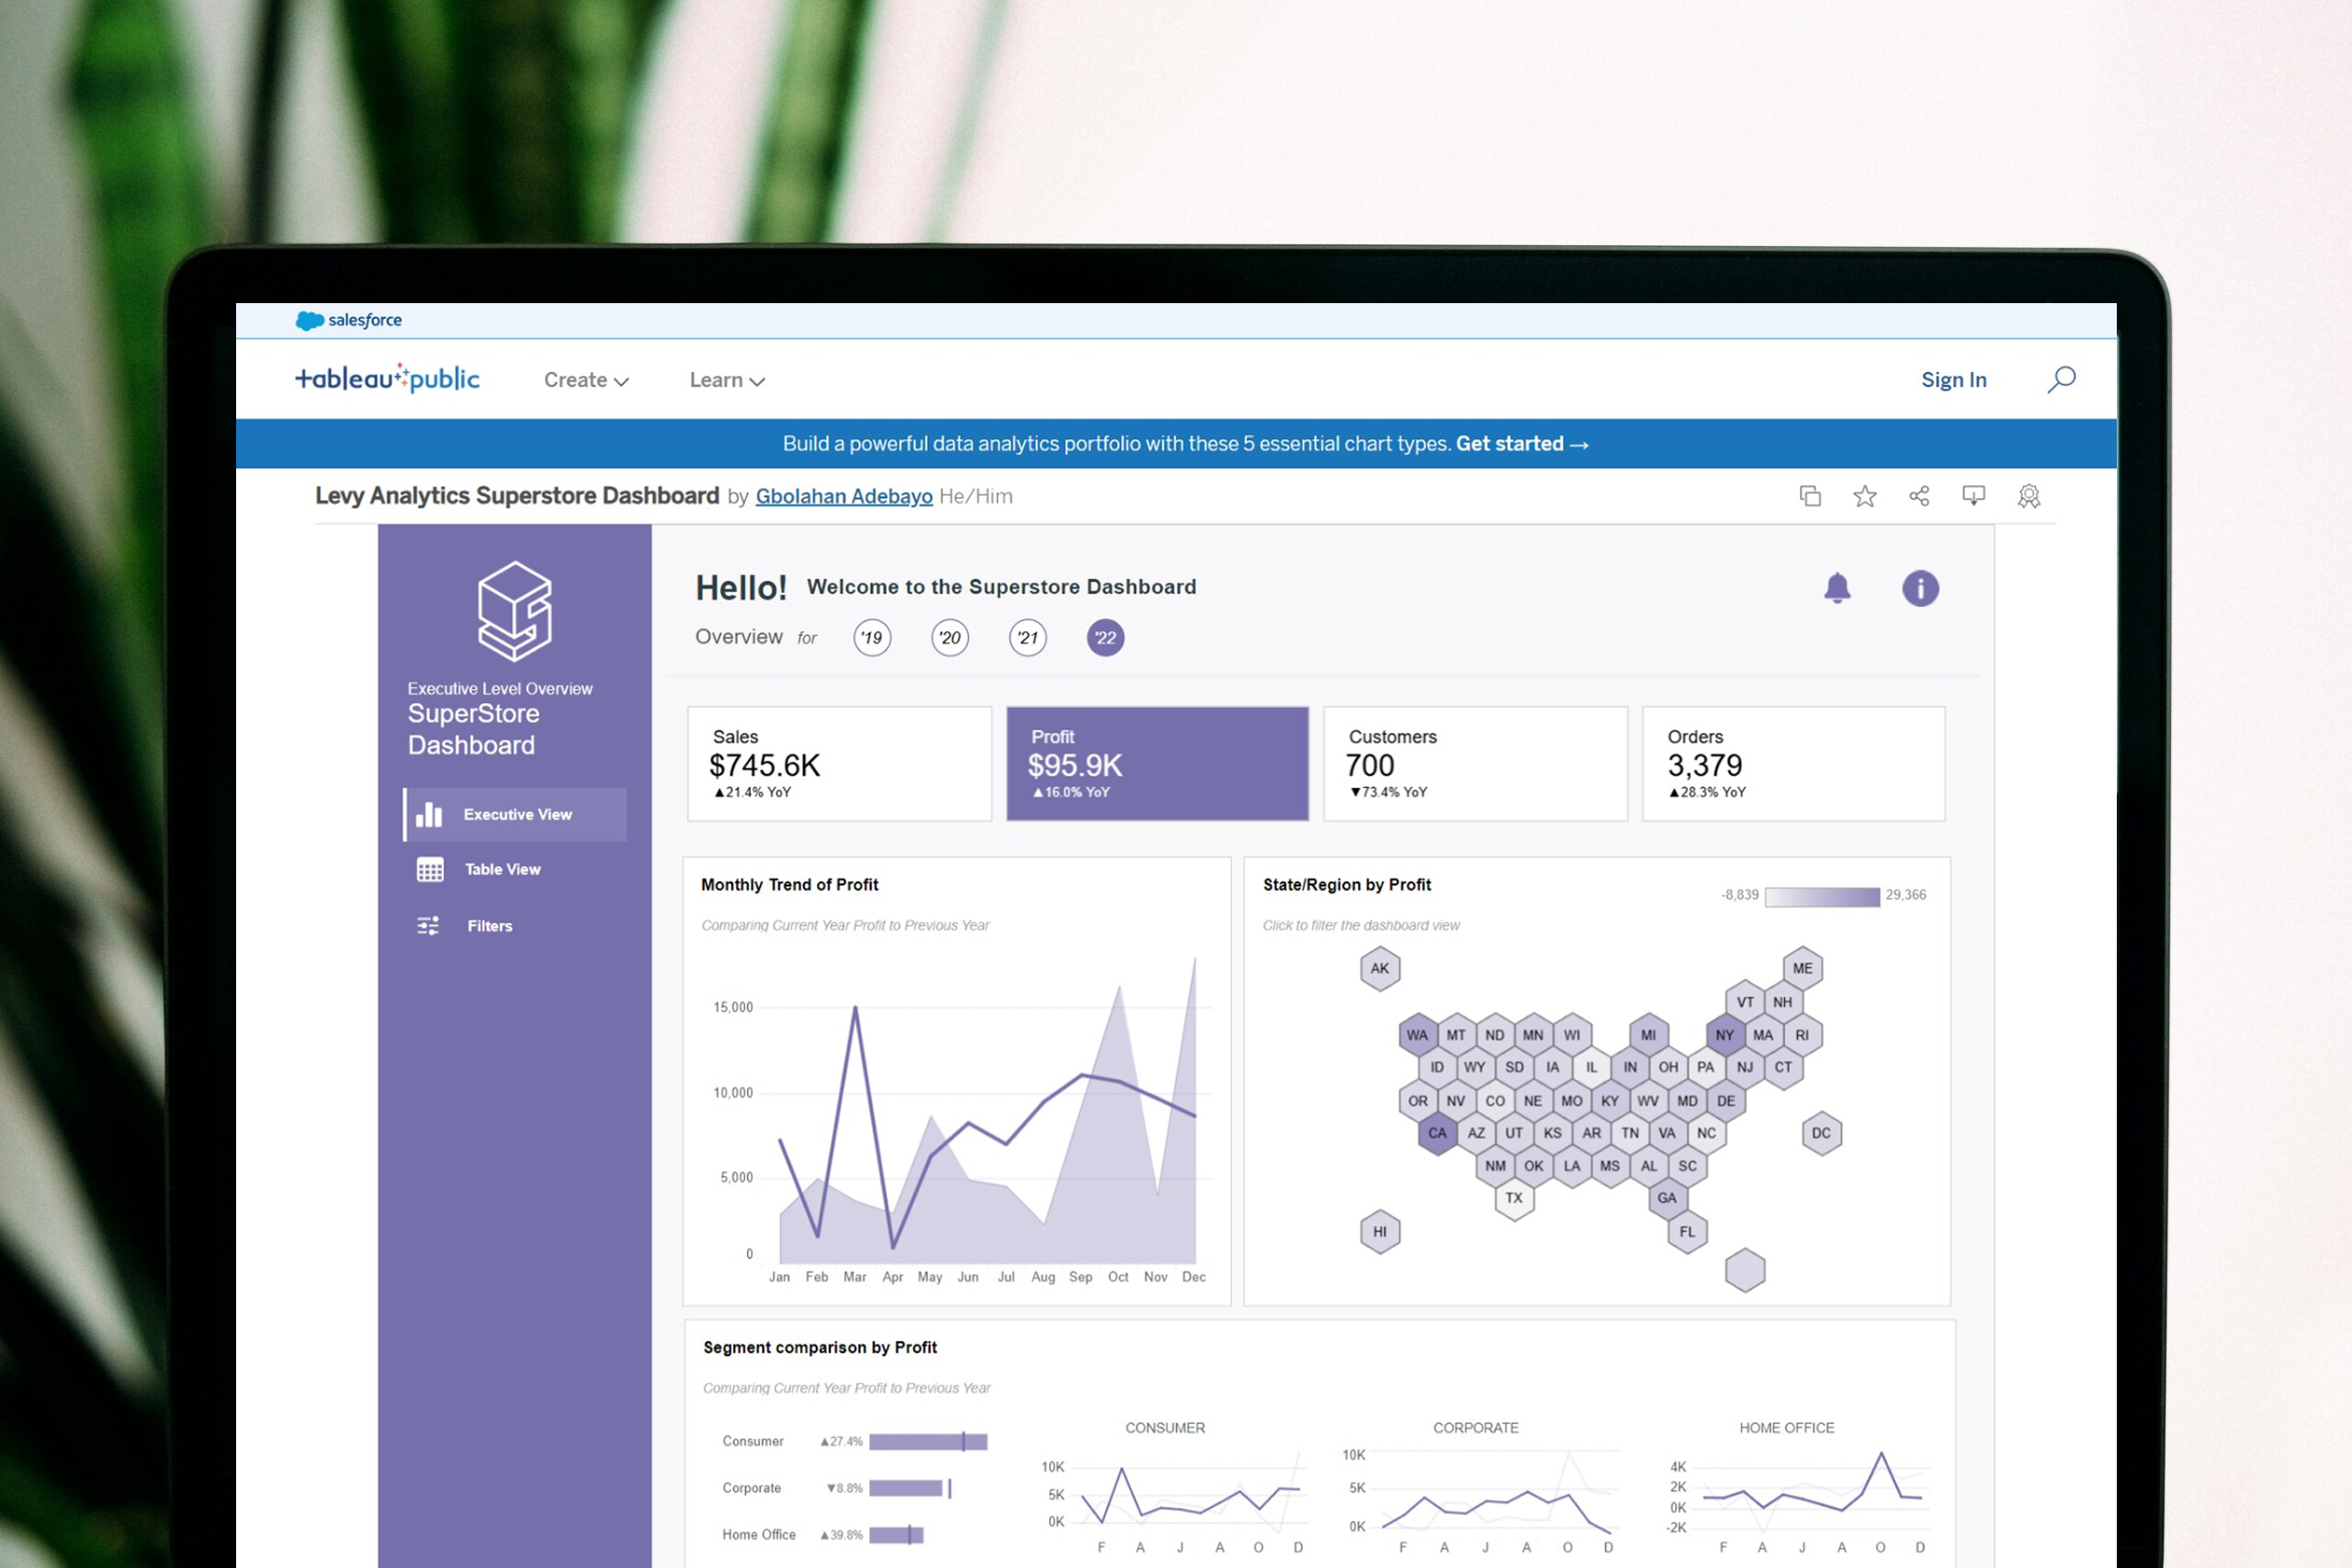
Levy Analytics Group transforms complex data into intuitive visual insights, enabling clients to understand and act on their data quickly and effectively. By leveraging cutting-edge visualization tools, we make data easily interpretable for all stakeholders.

Creating Effective and Efficient Analytics
Data Architecture
Design datasets with trusted patterns that balance performance and accessibility.
Data Engineering
Automate your data workflows using advanced processing tools that leverage the full scalability of the cloud.
Data visualization can help companies in many ways.
Gain Insight
Data visualization helps businesses understand large data sets, identify patterns and errors, and focus on areas showing progress or red flags.
Communicate Complex Information
Data visualization can help marketers communicate complex information in a clear and visually appealing way.
Engage Audiences
Data visualization can help boost brand engagement and make it easier for potential customers to find and process information.
Track Performance
Data visualization tools can help organizations easily create dynamic dashboards to effectively track performance metrics and KPIs.
Make Decisions
Data visualization can help businesses make faster and more accurate decisions by providing a better view of customer opinions and needs.
Improve Business Performance
Data visualization helps businesses draw better conclusions, interpret complex data, and identify correlations.

